A long time ago (in May 2003), I started working at the Eindhoven University of Technology as an Assistant Professor with a focus on Retail Operations. My background in operations management/research but also in econometrics and multi-variate data analysis proved to be a good basis for this stream of research.
The core of the work dealt with empirical analysis of the shelf stacking processes, advanced demand forecasting, and the ordering behavior of store managers. Additionally, I did more analytical research on the inventory management of perishable items, and inventory management including demand seasonality.
One particularly interesting paper we worked on, is:
Van Donselaar K., V. Gaur, T. Van Woensel, R.A.C.M. Broekmeulen, J.C. Fransoo (2010), Ordering Behavior in Retail Stores and Implications for Automated Ordering, Management Science, Volume: 56, Issue: 5, Pages: 766-784
In this paper, we studied the ordering behavior of retail store managers in a supermarket chain to characterize such deviations in ordering behavior, investigate their potential drivers, and thereby devise a method to improve automated replenishment systems. For me, this is one of my first papers I worked on, that looked into the interfaces between data – information – decision making (which would probably now be called prescriptive analytics).
An automated inventory replenishment system, implemented in a retail store, recommends order quantities to the store manager every order cycle, typically once a day. A store manager however may choose to sometimes bypass the system, and instead decide orders manually. Store managers may easily find shortcomings in the inventory system and may come up with some simple fixes. Shortcomings could be related to not taking into account all relevant information, or poor implementation.
From data to information
The following figure illustrates the main phenomenon analysed in this paper by comparing the weekly seasonality patterns of demand (grey bars), orders recommended by the automated system (black bars), and actual orders (white bars) for a slow-moving item (a body lotion stock-keeping unit) in one store aggregated over 52 weeks.
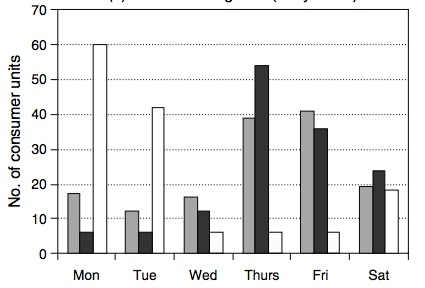
Observe that the automated order advices are concentrated on Thursdays and Fridays, i.e., with a one-day offset before the peak days of the seasonality of demand. The actual orders placed by the store managers, however, are concentrated on nonpeak days and have the opposite pattern. Thus, store managers behave quite differently from the automated ordering system. By interviewing them and analyzing their orders and fill rates, we found that they increase order quantities on nonpeak days, which correspondingly reduces the order quantities on peak days. Thus, they effectively advance orders from peak days to preceding nonpeak days. A reason for this was in-store workload balancing (handling), which was not taking into account in the inventory system.
Using orders, shipments, and point-of-sale data for around 20,000 item–store combinations over five stores, we showed that (i) store managers consistently modify automated order advices by advancing orders from peak to nonpeak days, and (ii) this behavior can be explained significantly by product characteristics such as case pack size relative to average demand per item, net shelf space, product variety, demand uncertainty, and seasonality error.
Our regression results suggested that store managers improve upon the automated replenishment system by incorporating two ignored factors: in-store handling costs and sales improvement potential through better in-stock.
From information to decision making
Based on these results, we constructed a method to modify automated order advices by learning from the behavior of store managers. Motivated by the management coefficients theory (Bowman 1963), our method is efficient to implement and outperforms store managers by achieving a more balanced handling workload with similar average days of inventory.
The below figure gives a nice summary of our results from the models. In the parameter omega in the X-axis indicates the effect of advancement of orders. A smaller multiplier means less advancement of the order quantities from peak to nonpeak days, whereas a larger multiplier means more order advancement. The scenario with a multiplier equal to zero represents the currently used inventory system, without intervention of the store manager.

The change in range (Y-axis) has a U-shaped curve. For small values of the multiplier, an increase in order advancement results in a more balanced workload, and thus, a decrease in range. For large values of the multiplier, it means that orders are advanced too much from peak to nonpeak days, so that the original nonpeak days become the new peak days, and the handling workload is again imbalanced.
Finally, note that the current performance of the stores is also plotted in the figure. Clearly, the store managers do better than the currently used inventory system, without intervention, but do worse compared to the improved inventory control mechanisms (modified based on the learned behavior of the store managers). This is mainly due to the inconsistency of the decision making of the managers (due to time limitations, thousands of items to manage, etc.).
Contact me for more information or to work together on similar issues in your practice.
Some other interesting references:
- Bowman, E. H. 1963. Consistency and optimality in managerial decision making. Management Science, 9(2) 310–321.
- Ehrenthal, J., D. Honhon, T. Van Woensel (2014), Demand seasonality in retail inventory management, European Journal of Operational Research, 238(2), pp. 527–539
- Gür Ali O., S. Sayın, T. Van Woensel and J. Fransoo (2009), Pooling Information Across SKUs for Demand Forecasting with Data Mining, Expert Systems with Applications, Volume 36, Issue 10, Pages 12340-12348
